Three ETF Fee Layers Your Broker Charges Before the Fund Manager Takes Its Cut
When you buy an exchange-traded fund, the prospectus tells you the expense ratio. That number—often 0.03% for a broad index fund or 0.25% for a factor strategy—feels reassuringly small. But it is not the full story. Between the moment you place an order and the moment your holdings generate a return, at least three separate layers of fees are extracted by parties you never see on the trade confirmation. This article traces each layer, names the collectors, and shows why the stated expense ratio can understate true cost by 30–50%.
The First Cut: Broker Execution Fees You Never See on the Trade Confirmation
The most obvious fee is the commission—or rather, its disappearance. Many brokers now offer commission-free ETF trades. But that zero is not free; it is subsidized by a series of less visible charges. The first is the bid-ask spread. When you buy an ETF, you pay the ask price; when you sell, you receive the bid. The difference, known as the spread, is a direct cost that can range from roughly 0.01% for highly liquid funds like those tracking the S&P 500 to 0.5% or more for niche thematic or fixed-income ETFs. This spread is captured by market makers and, indirectly, by your broker if it internalizes order flow.
A second hidden mechanism is payment for order flow (PFOF). Your broker routes your order to a wholesaler who executes it, and the wholesaler pays the broker a rebate—often a fraction of a cent per share. In return, the wholesaler may fill the order at a price slightly worse than the national best bid or offer. Studies estimate that PFOF costs retail investors roughly 0.1–0.2% on a typical trade, though the exact impact varies by broker and market conditions. The SEC and ESMA have debated PFOF for years, but it remains legal in the US and is banned in the EU and UK.
Then there is securities lending. When you hold an ETF, your broker may lend out the shares to short sellers, earning a fee. In many standard brokerage agreements, the broker keeps 30–50% of that lending revenue, and the fund or the investor receives the remainder. This is not a cash deduction from your account, but it is an opportunity cost: the lending income that could have reduced fund expenses instead flows partly to the broker. Some estimates put the annual drag from foregone lending income at roughly 0.2–0.5% for popular ETFs, though it varies widely.
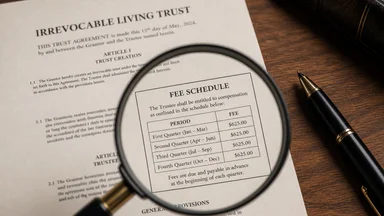
Inactivity and account maintenance fees add another layer. Some brokers charge quarterly fees of US$20–50 if your account balance falls below a threshold, or if you do not trade frequently enough. While these fees are often waived for larger accounts, they can eat a significant percentage of small portfolios. For an account of US$10,000, a US$40 quarterly fee equals 1.6% annually—far more than any expense ratio.
Finally, if you buy ETFs denominated in a foreign currency, your broker typically applies a forex conversion fee. This can range from 0.5% to 1% each way, meaning a round-trip trade costs 1–2% in currency conversion alone. For investors holding non-US ETFs or trading in multiple currencies, this layer can dominate all other costs.
The Second Cut: Custodial and Administrative Fees Wrapped Into the Expense Ratio
The expense ratio you see in the prospectus includes several components that are themselves fees paid to third parties. The largest is the management fee, which goes to the fund sponsor. But within that reported number, there are sub-layers. The custodian bank—typically a large institution like State Street, JPMorgan, or BNY Mellon—charges a safekeeping fee, usually in the range of 0.01–0.03% of assets annually. This covers the physical or electronic custody of the fund's securities.
Transfer agent and record-keeping fees add another 0.02–0.05%. These cover maintaining shareholder accounts, processing dividends, and mailing statements. For a large ETF with millions of shareholders, these costs are spread thin, but they still appear in the expense ratio. Audit and legal fees, typically 0.01–0.03%, pay for annual audits by accounting firms and legal compliance with securities regulators.
Index licensing fees are a notable line item. If the ETF tracks a branded index like the S&P 500, MSCI World, or FTSE 100, the fund pays a license fee to the index provider. These fees are generally 0.01–0.08% of assets under management, but for niche indexes, they can be higher. The index provider collects this regardless of fund performance.
Distribution fees, known as 12b-1 fees in the US, can add up to 0.25% for certain share classes, particularly those sold through brokers or financial advisors. These fees are intended to cover marketing and distribution costs, but they effectively reduce the return for investors in those share classes. In Europe, similar charges exist under different names, such as ongoing charges figures that include distribution costs.
The sum of these custodial and administrative fees typically accounts for about 0.05–0.15% of the reported expense ratio. While small, they are part of why a 0.03% index fund can still have real costs that exceed the headline number.
The Third Cut: Portfolio Turnover Costs the Expense Ratio Ignores
Every time an ETF buys or sells underlying securities, it incurs trading costs. These costs are not included in the expense ratio because they are considered part of the fund's investment activity. But they are real costs that reduce net asset value. The primary component is the bid-ask spread on the underlying stocks or bonds. For a large-cap equity ETF, this spread might be 0.05–0.20% per trade. If the fund turns over 20% of its portfolio annually, that translates to a cost of roughly 0.01–0.04% per year.
Brokerage commissions on rebalancing trades also add up. While institutional commissions are low—often less than 0.01% per share—they still accumulate. For an ETF that rebalances quarterly, the annual commission cost might be 0.02–0.10% of assets. Market impact costs, where a large trade moves the price against the fund, can add another 0.01–0.05% per trade, particularly for less liquid securities.
Cash drag from dividend reinvestment timing is another subtle cost. When a fund receives dividends, it may hold the cash for several days before reinvesting. During that time, the cash earns near-zero interest, creating a small drag on returns. This effect is typically around 0.02–0.08% annually for equity ETFs.
Synthetic ETFs, which use swaps or futures to replicate an index, face additional costs from rolling derivatives contracts. These rolling costs can add 0.10–0.30% annually, depending on the market conditions and the structure of the swap. While synthetic ETFs often have lower reported expense ratios, their total costs can be higher when rolling costs are included.
Academic research, including a 2022 study by Novy-Marx and Rau, estimates that these turnover-related costs add roughly 0.4–0.6% to the true cost of an ETF, on top of the stated expense ratio. For high-turnover strategies such as factor or smart-beta ETFs, the gap can be even larger.
Who Collects Each Layer: A Flow-of-Funds Map
Understanding who gets paid is key to minimizing costs. The broker-dealer captures the execution spread and any payment-for-order-flow rebates. When you trade, your broker may also earn interest on uninvested cash. The custodian bank earns safekeeping and transaction fees, which are passed through to the fund and ultimately to you.
The fund manager collects the management fee after paying the index provider and other service providers. Securities lending revenue is split between the broker (typically 30–50%) and the fund (50–70%). The fund's share reduces expenses or is paid out as income, but the broker's share is a direct cost to you.
Platform fees, such as those charged by advisory platforms or robo-advisors, add another layer on top. These wrap fees range from 0.25% to 1.00% annually and are levied on the total assets under management. They cover the platform's technology, customer service, and sometimes financial advice.
In a typical scenario, an investor in a 0.10% expense ratio ETF through a 0.50% wrap account might face a total cost of 0.60% from these explicit fees. But when hidden layers are added—execution costs of 0.15%, securities lending drag of 0.20%, and turnover costs of 0.30%—the total can approach 1.25%. That is more than ten times the advertised expense ratio.
Why the Stated Expense Ratio Understates True Cost by 30–50%
Regulators in the US (SEC) and Europe (ESMA) require funds to disclose the expense ratio, but they do not require disclosure of trading costs or securities lending splits. As a result, the expense ratio gives an incomplete picture. The 2022 study by Novy-Marx and Rau found that the hidden costs of ETF investing average 0.4–0.6% annually, meaning a fund with a 0.10% TER can have a true cost of 0.35–0.50% or more.
High-turnover strategies amplify the gap. A factor ETF that rebalances frequently may have turnover costs of 0.5–1.0% annually, while a passive index fund that buys and holds may have turnover costs below 0.1%. The difference explains why some low-cost ETFs still underperform their benchmarks.
Investor behavior costs—such as buying at peaks and selling at troughs—dwarf all fee layers combined. Research by Dalbar and others estimates that the average investor underperforms the market by 2–4% annually due to poor timing. While not a fee per se, this cost is real and often exceeds any expense or trading cost.
The implication is clear: focusing solely on the expense ratio is like judging a restaurant by the cover charge while ignoring the price of the meal. A comprehensive cost analysis must include all three layers.
Trade-Offs and Counter-Arguments: Are Some Hidden Fees Worth Paying?
Not all hidden fees are created equal, and some may be justified by the benefits they provide. For example, payment for order flow has been criticized for inflating execution costs, but it also enables commission-free trading, which benefits small investors who trade infrequently. A 2023 analysis by the SEC estimated that banning PFOF could increase explicit commissions by around US$2–5 per trade, potentially harming low-balance accounts. Similarly, securities lending generates revenue for brokers and funds alike; without it, expense ratios might be slightly higher to compensate for lost income.
Another trade-off involves custodial fees. Large institutional custodians like State Street or BNY Mellon provide robust safekeeping and transaction processing that reduces operational risk. A fund that uses a cheaper, less established custodian might save a few basis points but expose investors to higher risk of error or fraud. The extra 0.01–0.03% for a top-tier custodian is often a worthwhile insurance premium.
Turnover costs also have a nuance: higher turnover can be a sign of active management that aims to capture alpha. For factor-based ETFs that tilt toward value or momentum, the turnover cost of 0.5–1.0% annually is a trade-off for potential outperformance. A 2021 study by Fama and French found that value factor premiums historically averaged around 3–5% per year, which can more than offset the turnover drag. The key is to verify whether the fund's strategy actually delivers on its promise.
For buy-and-hold investors using broad-market index ETFs, the hidden fees are almost pure drag. But for those using tactical or thematic products, the fees may be part of a deliberate strategy with expected net benefits. The decision requires a personal cost-benefit analysis.
A Practical Example: Comparing Two Popular ETFs
To illustrate the real-world impact, consider two hypothetical but representative ETFs: ETF A tracks a broad US large-cap index with an expense ratio of 0.03%, while ETF B is a smart-beta fund focused on low volatility with an expense ratio of 0.25%. At first glance, ETF A appears vastly cheaper. But when we add hidden layers, the picture changes.
ETF A has high liquidity, with a typical bid-ask spread of 0.01%. Its turnover is low, around 5% annually, so turnover costs are roughly 0.005%. Securities lending drag is modest at 0.10% because the fund lends heavily and the broker keeps 40% of the revenue. Total hidden costs for ETF A: spread (0.01%) + turnover (0.005%) + lending drag (0.10%) = roughly 0.115%. True cost: 0.03% + 0.115% = 0.145%.
ETF B is less liquid, with a spread of 0.20%. Its turnover is higher at 40% annually, leading to turnover costs of about 0.04%. Securities lending drag is similar at 0.10%. Total hidden costs: 0.20% + 0.04% + 0.10% = 0.34%. True cost: 0.25% + 0.34% = 0.59%. The gap between the two funds shrinks from 0.22 percentage points in expense ratios to 0.445 percentage points in true cost. ETF B is still more expensive, but the difference is less dramatic than the headline numbers suggest.
This example underscores why investors should not rely solely on the expense ratio. A low expense ratio does not guarantee low total costs, and a higher expense ratio may still be acceptable if hidden layers are well-managed.
How to Audit Your Own Portfolio for Fee Leakage
You can estimate your true costs with a few steps. First, check your broker's order execution quality report. In the US, brokers are required to publish Rule 605 reports that show the effective spread on trades. Compare the effective spread to the quoted spread to see how much your broker's order routing costs you.
Second, request the securities lending income split from your broker. Some brokers, like Interactive Brokers, disclose this in their account statements. If you do not see it, ask customer support. If the broker keeps more than 50% of lending revenue, consider switching to a broker that passes more to clients.
Third, calculate the turnover rate of your ETF using the fund's semi-annual report. The report lists the portfolio turnover rate, usually as a percentage. Multiply that by an estimated average trading cost of 0.10% to get a rough turnover cost. For example, a turnover of 50% implies a cost of roughly 0.05% annually.
Fourth, compare the effective spread to a benchmark using free tools like Morningstar's ETF screener, which shows bid-ask spreads and median trading volumes. A spread above 0.10% for a large-cap ETF is a red flag.
Finally, consider switching to direct indexing if your portfolio is large enough and your costs exceed 0.5% annually. Direct indexing lets you own the underlying stocks directly, avoiding the ETF wrapper and its layers. For smaller portfolios, look for ETFs with low turnover, high liquidity, and transparent fee structures. As we discussed in a related article, regulatory changes can also affect costs.
Remember that even a low-cost ETF can carry hidden fees. The key is to look beyond the prospectus and trace the flow of funds from your order to the final return. No investment is truly free; every layer of intermediation takes its cut.
This article is for informational purposes only and does not constitute personalized investment advice. Consult a qualified financial advisor for recommendations tailored to your situation.